
 The second day of the 9th Global Investigative Journalism Conference offered data-driven journalists the opportunity to sharpen their skills through sessions focused identifying useful data, extracting it, cleaning it, analyzing it, visualizing it and finally, telling a story with it.
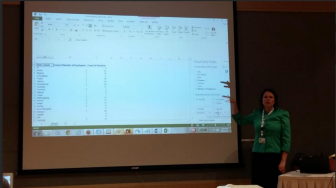 “Journalists choose to use Microsoft Excel as a database because it is simple, flexible, and it summarizes and filters data within minutes,” explained Megan Luther, training director at Investigative Reporters and Editors, in the session Pivot Tables in Excel. “The two important tools it offers are filters and pivot tables. Filters allow you to only see the items you need without changing the underlying data, and pivot tables are a powerful summary tool for large databases.”
Luther emphasized that during an investigation, journalists should write results from the pivot table just like writing a sentence in a story. It will help you tell a story faster.
“I was scared of Excel, but after attending the workshop I am feeling more confident. Excel is a very essential tool for a journalist as it helps find, clean, and weed through large data sets to tell extraordinary and impactful stories.” — Waseem Abbasi an investigative journalist from Pakistan.
“Data reporting is the ability to dig into the most compelling information using large data sets,” noted Brant Houston, author of Computer Assisted Reporting and Knight Chair of Investigative Reporting at the University of Illinois. Houston led the session Basic Math for Managing Data, where he emphasized the need to learn basics of data analysis and explained how to find great stories through ratios, rates, percentage change, and summarizing data with pivot tables.
Both Luther and Houston insisted that a database alone is not a story, but rather a source of information that needs to be researched and investigated with great caution.
Data Visualization
“Humans are visual creatures and visualization helps people explore and understand information quickly,” said Sophie Sparkes, data analyst at Tableau. Sparkes explained how compelling and interactive data visualizations can be created on short deadlines.
Useful Sites and Software:
- Tableau Public, a visualization tool for journalists which can be downloaded for free
- Datawrapper, an open source tool that creates charts within minutes
- Plotly for graphs
- CartoDB for maps
- Gephi for social networks
Both Houston and Sparkes agreed that data journalism and journalism are two sides of the same coin; journalists irrespective of their fields and interests should acquire basic tools in data gathering, analysis, and visualization.
